untitled article
 Updated 13/3/24
by
Katarzyna
Updated 13/3/24
by
Katarzyna
Who can use this function? Function available to CargoON and Trans for Forwarders users who have purchased the complementary product: BI Reports. Reports are visible to users selected by the company ordering access. Learn more about BI Reports. |
The Performance report provides information that helps measure the effectiveness of the activities undertaken by your company on the Trans.eu Platform and CargoON.
With the report you can:
- measure your company's activity on the Platform
- investigate monthly, quarterly and annual increases in activity
- check the demand for your freights on selected routes
- measure the response your offers get on the Platform
- gain control over the transactions concluded on the selected routes
Navigating through the Performance report
In the main menu, select the BI Reports module and open the Performance tab.
The information featured in the report is associated with the Freights module.
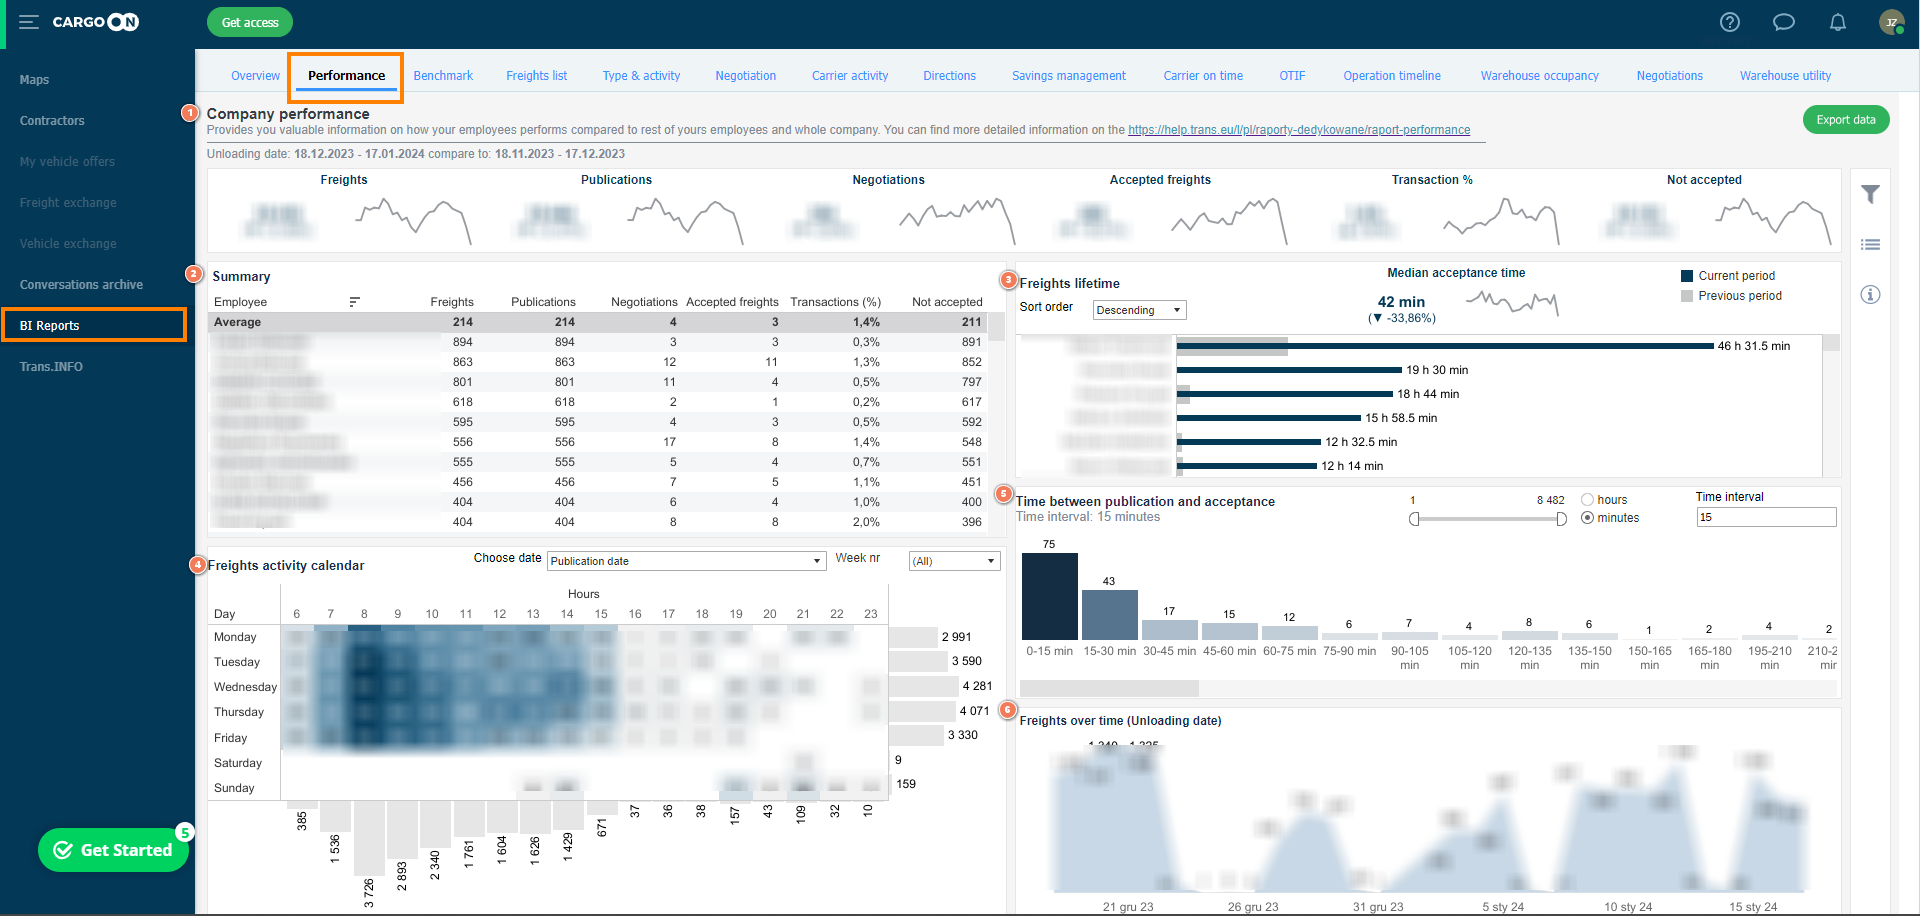
The report consists of 6 main sections:
- Company performance - tiles with company metrics
- Summary table - a tabular presentation of summarised information on the company's activity
- Freights lifetime - a bar chart showing the time of acceptance of freights by employees.
- Publication date calendar - a calendar with the number of publications.
- Time between publication and acceptance - a bar chart indicating the speed of concluding transactions
- Freights over time - a chart showing how activity on the Platform is distributed over time.
Company performance
In the first top section of the report, there are tiles which present the sum of key metrics related to the company as a whole (i.e. the company account on the Platform with an individual TransOffice number).
The TransID that you use to log in to the Platform consists of TransOffice and your sequence number following the dash. e.g. if your TransID is 10023-2 -> number 10023 is your company's TransOffice and 2 is your sequence number (your account was created as the second one).

Hover the mouse cursor over the selected tile - you will see a balloon with a description explaining the value presented in the tile.
What each tile means:
- Freights - total number of freights published on the Trans.eu Platform
- Publications - total number of offer publications on the Trans.eu Platform
- Sent offers - total number of carriers who received an offer of a unique freight
- Responses - total number of carriers who sent a price proposal in response to the unique freight offer received
- Responses% - percentage of carriers who sent a price proposal to the unique freight offers received
- Accepted freights - total number of published freights which resulted in a transaction
- Transaction% - percentage of transactions concluded in relation to the number of freights published
- Not accepted - total number of freights published that eventually did not result in a transaction.
Summary table
The next section of the report is a tabular presentation of your company's activity for individual employees. Information in the Summary table is adjusted to the range defined in the filters.

The table consists of the following columns:
- Employee - employee of your company who accepted a freight (concluded a transaction) in the selected time frame
- Freights - number of freights added to the Platform by the employee
- Publications - total number of freight publications made by the employee
- Sent offers - total number of carriers who received a unique freight offer sent by the employee
- Responses - total number of carriers that sent a price proposal to the received unique freight offer sent by the employee
- Responses% - percentage of carriers who sent a price proposal in response to the unique freight offers received, published by the employee
- Accepted freights - total number of freights published by the employee that ended in a transaction
- Transaction% - percentage of concluded transactions compared to the number of freights published by the employee
- Not accepted - total number of freights published by the employee that eventually did not result in a transaction
- Average row indicates average values of the individual columns
In the table, you can apply sorting: from smallest to largest values, from largest to smallest ones or A-Z/Z-A. Simply hover the mouse cursor over the column name and click on the sorting symbol.
If you hover the mouse cursor over a selected cell in the table, you will see a pop-up with additional information. It is particularly useful when you have a long list of employees.
Freights lifetime chart
On the right side, you can see the Freights lifetime chart, which only displays information about freights accepted in the context of employees.
The displayed information is dependent on the filter settings of the entire report.

You can sort the chart by changing the value in the Sort order column to descending or ascending.
Above the chart, you will see the following values:
- Median acceptance time - the median time (in minutes) of freight acceptance.
In the chart, you will also see all the information by hovering the cursor over the relevant part of the bar.
Publication date calendar
The calendar shows the distribution of the number of freight publications on individual days and hours.
The more intense the color, the more publications were made on a particular day at a specific hour.
You can display data based on the publication date or the acceptance date of the freights. You can also select a specific week of the year for analysis.

Thanks to the values on the right side of the calendar, you can check how many freights you publish on each day of the week and when acceptances most commonly occur.
With the values at the bottom of the calendar, you can see when you publish the most freights and when they are most often accepted.
The information in the calendar is displayed depending on the filter settings of the entire report.
Time between publication and acceptance chart
The bar chart shows the time it takes for freights to be accepted. It indicates how quickly a freight offer is accepted by the carrier after publication. The bottom legend displays the number of freights that were accepted within the specified time indicated on the side legend.
You can manually change Time interval. This allows you to further differentiate the division of freights into specific acceptance times.

When you hover over a selected bar, you will see a summary of the displayed information:

Freights over time chart (Unloading date)
The last part of the report is the Freights over time chart, which illustrates the distribution of the number selected in the value chart over time.
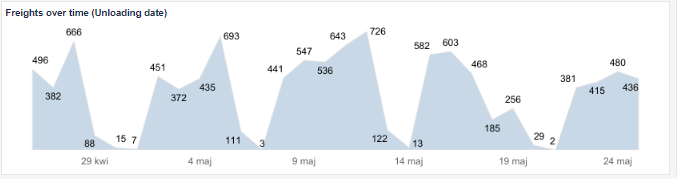
By clicking on the plus (+) and minus (-) symbols in the bottom-left corner of the chart, you can change the time scale in which the data is displayed.

Filtering
Click on the filter symbol in the right-hand column to open the Performance report filter settings.
In the filter settings you can choose:
- range of data displayed (Unloading date)
- trend comparison settings (Compare by): monthly, quarterly, annually, custom setting
- employee (Employee)
- publication type: No publication, Exchange, Fixed routes, selected/groups (Groups), SmartMatch
- route of your freight:
- direction by country (Country directions) - defined by the country letter code
- direction by postal code (Directions) - defined by the first two digits of the postal code
- precise route direction (Exact route)
Exporting report data
It is possible to export data from the Performance report. To do this, click the Export data button.
In the dialog box, select the file settings that you are interested in.
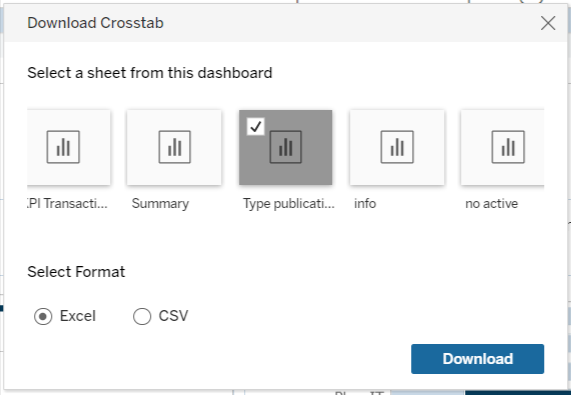
After clicking the Download button, the file will start downloading automatically.